|
|


| |

2nd Quarter 2014 SEE Update
By Laura Starks, CEO, Starks Energy Economics, LLC
The Power of the Permian
The Permian basin (West Texas and eastern New Mexico) comprises an area over 75,000 square miles, larger than the state of Washington. The first commercial discovery well was drilled almost a hundred years ago, in Mitchell County in 1920. Thirty billion barrels of oil have since been produced from the Permian.
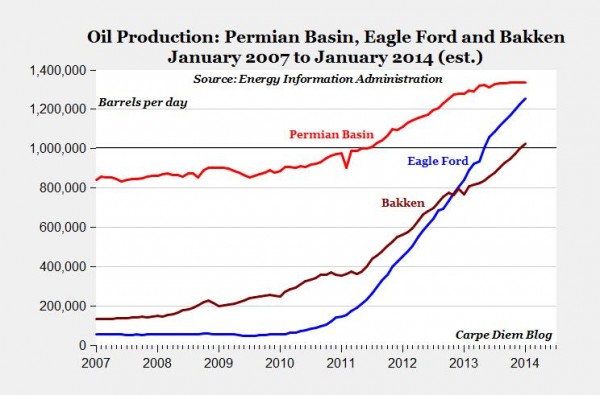
Today it supplies about twenty percent of U.S. domestic production, or 1.5 million barrels per day (BPD) out of 7.5 million BPD. Darrel Koo, of consulting firm ITG, projects a base case increase of 67%, to 2.5 million BPD of Permian oil production by 2025.
Energy Information Administration (EIA) data from late 2013 data in the Carpe Diem blog shows the importance of three U.S. oilfields: the Bakken in North Dakota, the Eagle Ford in south Texas, and the Permian in Texas and New Mexico:
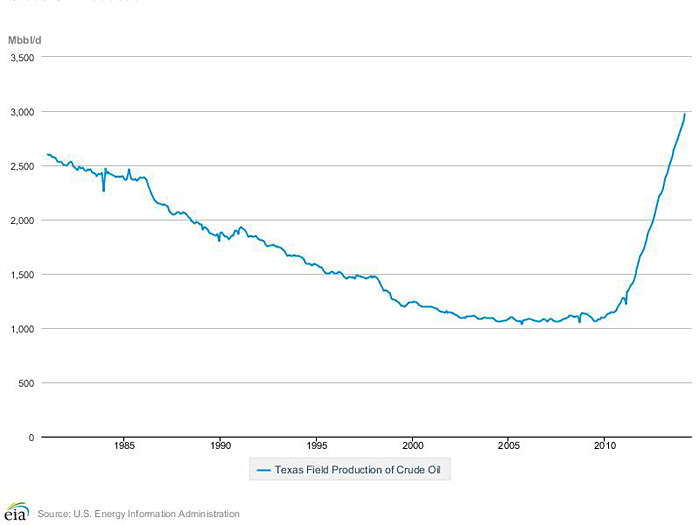
The Permian total rig count has grown from 92 in 2009 to nearly 500 rigs in the first quarter of 2014. It and the Eagle Ford play have driven the steep increase in Texas oil production. As of March 2014, Texas supplied about three million BPD of oil.
Growth in the Permian is evident from other indicators large and small:
- In 2013, it was estimated that over $600 billion would be needed to fully develop the basin. Although this is a huge amount of money, it is 1.5% of the $40 trillion the International Energy Agency (IEA) estimates is needed for global energy development through 2035.
- Two hundred independents are operating in the Permian, as are one-third of land rigs.
- According to analysts Tudor Pickering Holt, 260 horizontal rigs are operating in the Permian, or over 50% of the approximately 500 Permian rigs. In plays such as the Bakken, the horizontal percentage of the total is 100%.
- Apache, with 39 rigs and 3.3 million gross acres, increased the number of its Permian employees between 2010 and 2014 from 345 to 970 and its investment from $400 million to $2.6 billion.
- One company CEO quoted in a May 2014 Oil and Gas Investor article by Steve Toon, notes, "a vertical well will produce 140,000 barrels of oil equivalent over 30 years; now we're producing that in one horizontal zone in four months."
The Permian has been the hot-but-hidden play for five years. Over this time new operators, and some traditional ones, gradually ventured away from cheaper vertical Spraberry wells (at $1.5-$3.0 million apiece) to horizontal Wolfcamp wells (at $7-$12 million apiece.)
The Permian can be considered first from the surface in two dimensions, and then by productive zones, in three dimensions.
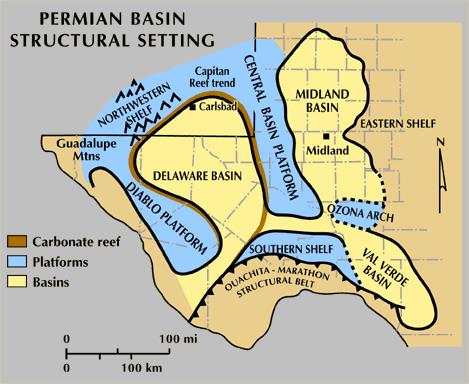
Areas of the Permian, Two Dimensions
The map below shows the division of the Permian between the Midland Basin to the east and the Delaware Basin to the west. The Delaware Basin has been explored later and less; thus, a higher percentage of its rigs are horizontal rather than vertical.
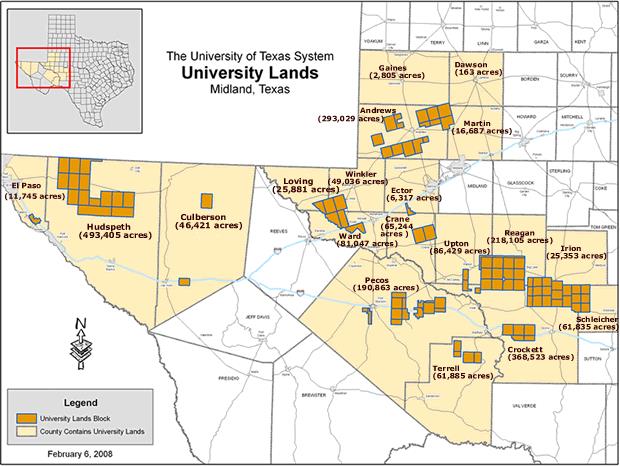
A Side Note on University Lands
Appropriately, the image above is from the University of Texas Bureau of Economic Geology.
A Dallas Morning News story by James Osborne points out that in the last five years, almost a billion dollars a year has flowed to the University of Texas and Texas A&M systems from the 2.1 million acres of University Lands, much of which sits atop the Permian Basin. Benefits include hundreds of millions in new construction throughout both systems and the ability to keep annual tuition under $10,000/year, a bargain compared to many other state and almost all private universities. During this time the endowment of the University of Texas has grown to $20.4 billion and that of Texas A&M to $8.7 billion.
Zones of the Permian, Three Dimensions
Three things separate the Permian from other shale basins and basins in which horizontal drilling is done.
The first is its long history as a vertical play, particularly in the Spraberry. Vertical well data helps identify and guide drilling for horizontal plays. Cheaper vertical wells, $100 oil prices, and the intense competition for people, equipment, and proppant initially made traditional vertical drilling a better proposition than horizontal drilling with fracturing. Also, according to Ann Vaughan of RBN Energy, since many Permian leases have held-by-production (HBP) requirements, the cheapest way to meet the requirement is to drill vertically. Thus, the shift to horizontal drilling has been slower than in the Williston (North Dakota) basin or the Eagle Ford.
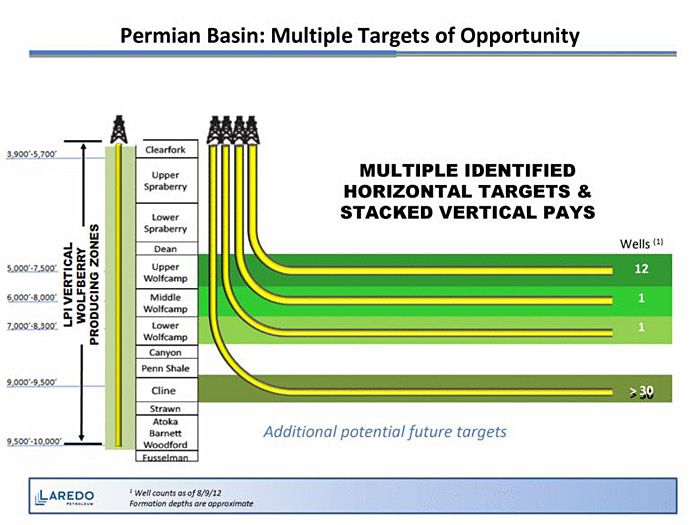
The second factor is the large number of productive zones, up to twelve. While not all acreage has all zones, more than twelve geologic zones prospective for oil have been identified. The Permian has a much thicker productive column than the Bakken: the Bakken has 130 feet, while the Permian has 2000 feet, with as much as one thousand feet in three Wolfcamp zones alone, plus the Cline (sometimes called Wolfcamp D), three Spraberry zones, Fusselman, Clearfork, Jo Mill, Strawn, Atoka, Avalon, and between three and six zones of Bone Springs. In the Midland Basin, the marquee zones are Spraberry for vertical wells and below it, the Wolfcamp for horizontal wells.
An illustration of Midland Basin stacked formations from Laredo Petroleum provided via the U.S. Securities and Exchange Commission (SEC) is shown below.
Third, because the Permian has been drilled for almost a hundred years, it has a baseline level of and access to midstream infrastructure like pipelines and storage. More is being built; the increase in light (less dense) crude production has also led to more construction of condensate splitters.
Water Availability, Disposal, and Recycle
According to Christopher Robart of PacWest Consulting Partners, annual drilling and completion water requirements in the Permian are expected to grow from 300 million barrels in 2013 to 464 million barrels in 2016.
Robart also predicts that the volume of annual produced and flowback water will grow from about 5 billion barrels to about 6.2 billion barrels in 2016. Recycling this much water will be a significant challenge. Filtration and electro-mechanical/chemical treatments are the most common recycling technologies. Chemical additives are next most common.
Other Challenges
In addition to water requirements, Permian companies face other challenges that derive from operating in a boom cycle:
- High cost or sheer unavailability of acreage, except through purchase, exchange, or joint venture;
- Availability of professional expertise;
- Equipment and proppant availability;
- Housing and living for the sudden population influx—one solution is to locate staff not needed continuously onsite three hundred miles away, in Fort Worth.
Overall, the Permian Basin oil will remain a critical part of U.S. energy supply for the next several years. The activity surrounding its drilling and production provides a significant boost to the Texas and U.S. economies.
Copyright 2014, Starks Energy Economics, LLC. This communication is based on information which Starks Energy Economics, LLC believes is reliable. However, Starks Energy Economics, LLC does not represent or warrant its accuracy. This communication should not be considered as an offer or solicitation to buy or sell any securities. I, Laura Starks, certify that, to the best of my knowledge, the views and opinions in this research report accurately reflect my personal views. These viewpoints and opinions may be subject to change without notice and Starks Energy Economics, LLC will not be responsible for any consequences associated with reliance on any statement or opinion contained in this communication. No Starks Energy Economics, LLC consultant or analyst has nor will receive direct or indirect compensation in return for expressing specific viewpoints in this report.


sitemap | home | contact us | bio | links | events
|
|
|