|
|


| |

4th Quarter 2014 SEE Update
By Laura Starks, CEO, Starks Energy Economics, LLC
Starks Energy Economics on Natural Gas
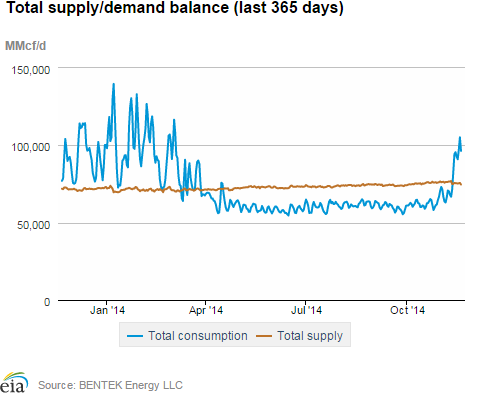
With winter arriving early it's worth considering the primary source of heat for our homes, offices, and plants—natural gas. In addition to heating, natural gas is used to produce electricity, to make petrochemicals, as a transportation fuel, and for export. However, the biggest variation in gas demand comes from variations in weather. Although the last twelve months were not typical given the extremely cold winter, they are illustrative: maximum demand was nearly 140 billion cubic feet a day (BCF/D) and minimum demand was a bit over 50 BCF/D, a turndown ratio of almost 3:1. Spikes continue: on November 18, Northeastern consumption alone was 27 BCF, 10 BCF above normal and its third-highest recorded November level.
Gas Reserves and Production
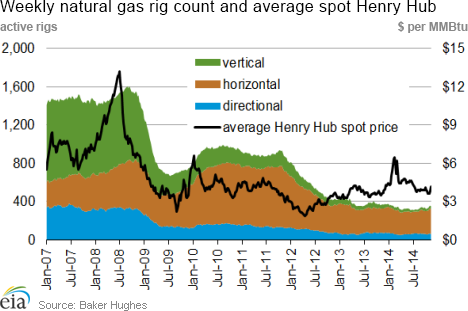
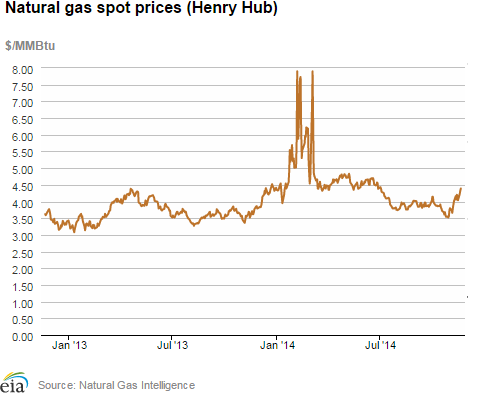
Horizontal drilling and fracturing technologies led to giant breakthroughs in economically producible U.S. gas reserves. Because so much supply was suddenly available and because gas prices are susceptible to competition with coal (in making electricity) and mild winter weather (for heating), gas prices turned against producers in 2012, leading many hydrocarbon producers to switch to oil production or, at a minimum, to emphasize "rich" gas—gas produced with a lot of light liquids. The Energy Information Administration (EIA) graph below shows gas rig count dropped approximately in concert with the gas spot price.
The U.S. is producing 70 BCF/D. Although this is more than average daily demand, the excess is stored between April and October for winter use.
An important "new" source of natural gas will be the capture and sale of the one-third of North Dakota gas production from oil wells in North Dakota that until recently was flared. As of October, North Dakota requires that 77% of its produced gas be captured rather than flared. At present, about 73-75% is captured. New wells are required to be connected to processing plants within a year of coming online. Flaring violations cost $12,500/day. More seriously, North Dakota regulators can require oil to be shut in if more than a quarter of its produced gas is flared.
Similarly, although the emphasis is on oil production in both the Permian and Eagle Ford basins in Texas, rising production there has also meant a rising level of casinghead or co-produced natural gas. However, in Texas 99.2% of this gas is already captured rather than flared.
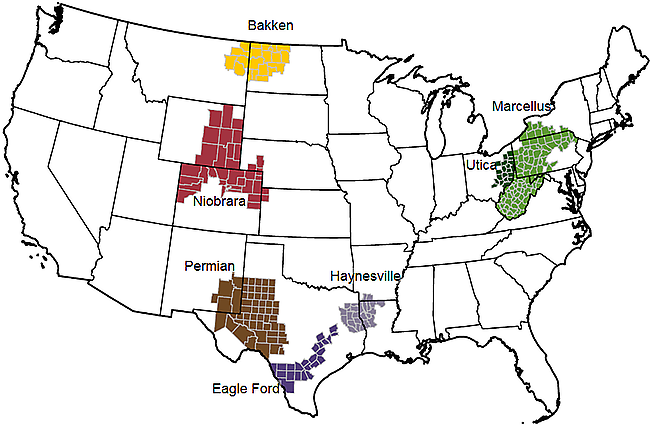
In addition to conventionally-produced natural gas, there are five main unconventional shale gas plays in the U.S.: the Barnett, the Woodford, the Fayetteville, the Haynesville, and the Marcellus. The largest of these, indeed the largest North American gas play, is the Marcellus in Pennsylvania and West Virginia. The EIA estimates that it holds 140 trillion cubic feet of estimated ultimate recoverable reserves (EUR). As of November, it is producing 16 BCF/D, or 23% of the U.S. total.
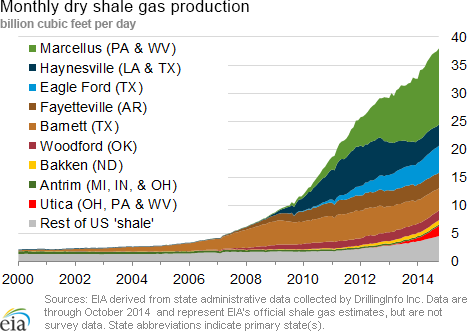
Ironically, the existing pipeline infrastructure was built to bring gas to the Northeast rather than away from it. The quick ramp-up of gas production, particularly in the Marcellus (from 2 BCF/D in 2010 to 16 BCF/D today) has led to large midstream infrastructure needs in the entire eastern half of the country that are only now being met for a) natural gas liquid (NGL) processing, and b) NGL and natural gas pipelines to the Northeast and elsewhere, particularly the Southeast and the Gulf Coast. A remarkable total of 41 projects have been proposed. RBN Energy estimates continued ramp-up of Marcellus production to 30 BCF/D by 2019. It is easy to understand why the Marcellus has earned the moniker of "The Beast from the East."
Among the several pipelines proposed and underway, one example is the reversal of the existing Rex Pipeline. When reversed, Rex is expected to move 1.8 BCF/D of natural gas from the Pennsylvania west to Chicago.
Storage
As the U.S. heads toward the 2014-2015 winter, starting gas storage levels of 3.6 trillion cubic feet are 5% lower than last year's levels and 6% lower than the five-year average. However, despite the extremely cold 2013-2014 winter, last year's storage levels were sufficient. Geographically, about half of the country's storage capacity is in the east, 35% is on the Gulf Coast, and 15% is in the west.
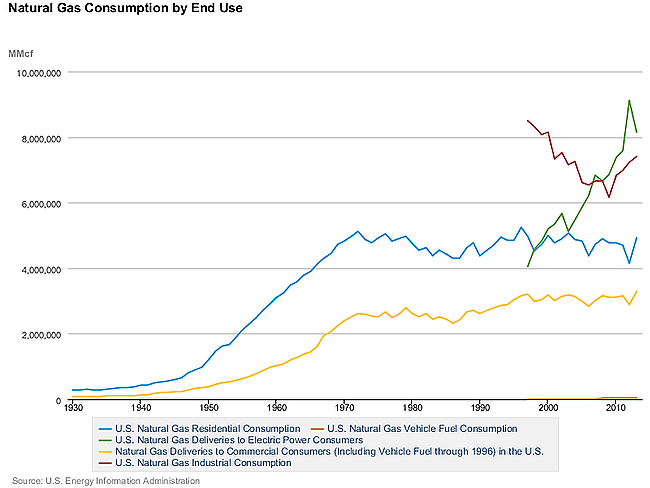
Natural Gas Demand
As the graph below shows, the combined volume of residential and commercial (offices) natural gas demand is now exceeded by the natural gas delivered to electric power companies to make electricity. Gas competes head-to-head with coal for the electric power market; combined-cycle generators can use both interchangeably. The industrial demand for natural gas shows a fall-off in the early 2000s when gas supplies appeared limited and manufacturing overseas was cheaper. As gas supplies were developed and the country came out of the 2008 recession, industrial demand likewise increased.
Regulations/Political
Federal, state, and local politics and regulations have a multitude of effects on natural gas use. The predominant one recently has been the favoring of the lower-carbon natural gas over coal for electricity production. With a change in the Senate majority to Republican—in particular, a West Virginia Senator elected on a pro-coal platform—the depth of this continuing trend toward gas and away from coal for electricity production is uncertain.
Drilling Cost Note
Since many onshore drilling rigs can be used for either oil or natural gas production, the recent fall in oil prices may put downward pressure on drilling costs that will also benefit natural gas drillers.
Gas Exports by Pipeline and from LNG Plants
Natural gas exports to Mexico from the U.S. are 2 BCF/D. Another 2.4 BCF/D of pipeline capacity through south Texas to Mexico is planned. Note that the Eagle Ford Shale extends across the border into the Burgos Basin, where it is called the Boquillas Formation. However, its development in Mexico is not expected soon.
Liquefied natural gas (LNG) exports from the U.S. Gulf Coast are on the near horizon with approval of Sabine Pass Liquefaction, Cameron LNG, Lake Charles Exports, and Freeport LNG. Combined, these four facilities will have the capacity to ship 7.3 BCF/D of gas. Sabine Pass, the furthest along, is expected to be operational by 2015. At this juncture, many more LNG plants have been proposed than are likely to be built.
Natural Gas Prices
Energy analyst Tudor Pickering Holt has lowered its estimate of the average 2015 gas prices to $3.35/MMBTU, absent another severe winter. It has also lowered its estimate of long-term gas prices to $4.00/MMBTU. Gas prices at Marcellus hubs are $0.50 to $1.50/MMBTU less than the Louisiana Henry Hub prices due to ample supply from the Marcellus and Utica and limited takeaway capacity.
Important SEE Publication Changes: Subtract Quarterly, add Monthly Summary
Please note two important changes in publication. 1) Starting in December, Starks Energy Economics, LLC will offer all registrants free monthly summaries of that month's investment analysis topic. These will take the place of the longer quarterly updates such as this one. 2) Subscribers will see a smaller change: rather than a separate letter for each month's article, your letter will be the summary paragraphs of the article. Just as now, subscribers will be automatically linked to the longer, detailed articles and the accompanying spreadsheets of segment-specific companies' financials. Subscribers will also receive first notification of and links to SEE company analyses published by Seeking Alpha and any other publications.
With these changes, we anticipate making the SEE experience more efficient as we look forward to a cheerful, successful 2015.
Copyright 2014, Starks Energy Economics, LLC. This information is confidential and is intended only for the individual named. This information may not be disclosed, copied or disseminated, in whole or in part, without the prior written permission of Starks Energy Economics, LLC. This communication is based on information which Starks Energy Economics, LLC believes is reliable. However, Starks Energy Economics, LLC does not represent or warrant its accuracy. This communication should not be considered as an offer or solicitation to buy or sell any securities.
I, Laura Starks, do hereby certify that, to the best of my knowledge, the views and opinions in this research report accurately reflect my personal views about the companies and their securities as of the date of this report. These viewpoints and opinions may be subject to change without notice and Starks Energy Economics, LLC will not be responsible for any consequences associated with reliance on any statement or opinion contained in this communication. No Starks Energy Economics, LLC consultant or analyst has nor will receive direct or indirect compensation in return for expressing specific recommendations or viewpoints in this report.


sitemap | home | contact us | bio | links | events
|
|
|