 |
 |
 |
 |
 |
 |
 |
 |
 |
 |
      |

Starks Energy Economics, LLC 3rd quarter 2012Focus: Low First-Half Natural Gas Prices Help Clean the AirRecent news about the environmental benefits of natural gas price competition with coal is upbeat: because US natural gas was so inexpensive in the first half of 2012, it displaced carbon-intensive coal as a generating fuel for electricity, part of the reason carbon dioxide emissions fell to their lowest level in twenty years. 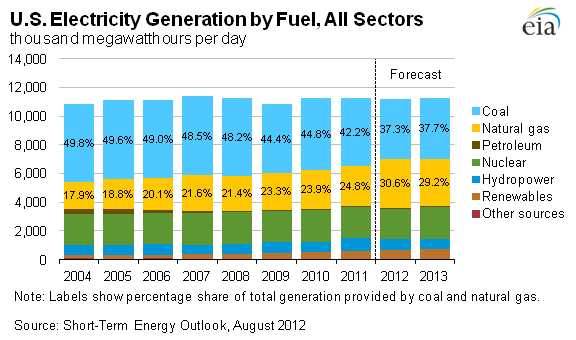 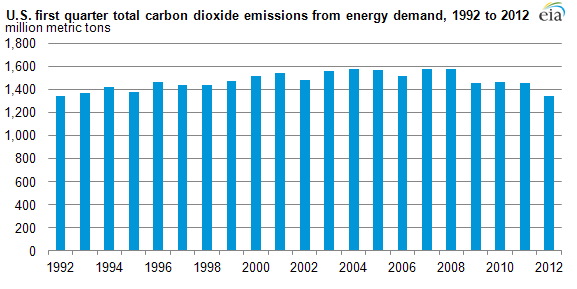 These changes can be seen above in the full-year projections by the Energy Information Administration (EIA) of a 25% increase in the use of natural gas for electricity generation almost completely offsetting coal use and the corresponding drop in CO2 emissions in the first quarter of 2012. The EIA gives a more complete explanation: a) CO2 emissions are typically highest in the winter from use of energy for heating, but last winter was exceptionally warm, reducing this demand (incidentally, much heating is from natural gas), b) The "excess" natural gas, coupled with its vastly increased US supply, led to such a low price that it displaced coal in the electric utility market. For example, the price of natural gas delivered to utilities between May 2011 and May 2012 fell an average of forty percent, from $4.91/million British Thermal Units (MMBTU) to $2.95/MMBTU. Utilities have moved from producing fifty percent of their electricity from coal in 2005 to 34 percent from coal in the early part of 2012. c) Reduced gasoline demand also led to reduced CO2 emissions. The graphs below show natural gas prices and a coal-natural gas price comparison. The source for the first graph is the EIA; for the second, the EIA and Stuart Staniford's blog. The coal price in the second graph is Central Appalachian coal. The vertical axes for both graphs are $/MMBTU. 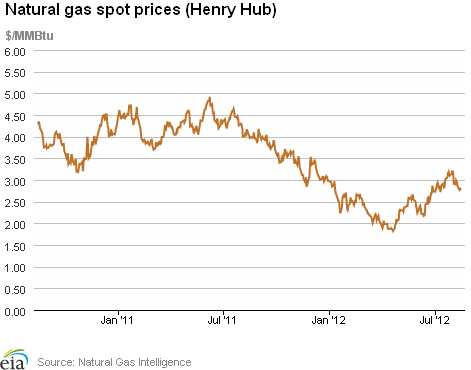 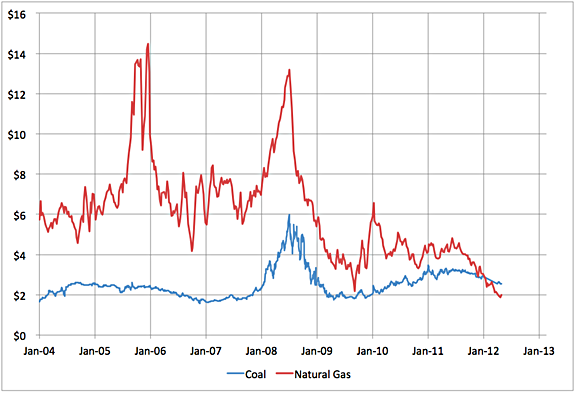 According to investment bank Tudor Pickering Holt (TPH), switching from coal to gas starts to occur when the price of natural gas falls below $3.50/MMBTU. Switching at the beginning of 2012 was 3 billion cubic feet (BCF)/day, and it rose to 10 BCF/day during the second quarter of 2012. (Average US consumption is over 60 BCF/day.) Total US natural gas consumption is 22-24 TCF/year, with about a third of that used for electricity generation. Moreover, according to TPH, gas demand is expected to increase 5-10% after 2015 due to EPA-required retirement of 40-70 gigawatts of coal-fired power. The US has the world's largest recoverable reserves of coal. In 2011, over a billion short tons was produced, with more than ninety percent of that used to generate electricity. Only recently have the technologies of horizontal drilling and fracking unlocked US natural gas reserves. This gas production is "trapped" in the US; the expensive facilities to liquefy and export natural gas as LNG are at least three to four years away from start-up. Coal companies do not face such export limits. So, as some have said, US natural gas is now being "exported" as coal. Coal companies find plenty of demand worldwide. China consumed four times more coal than the US in 2011, about half of all coal used in the world. India, too, is a big consumer. 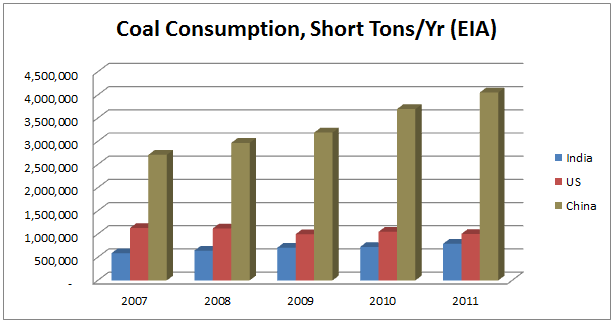 China and India produce much of the coal they use. Australia and Indonesia are large global coal suppliers. Carbon dioxide emissions from coal align with its use. So China is the largest emitter of CO2 overall and from coal use. 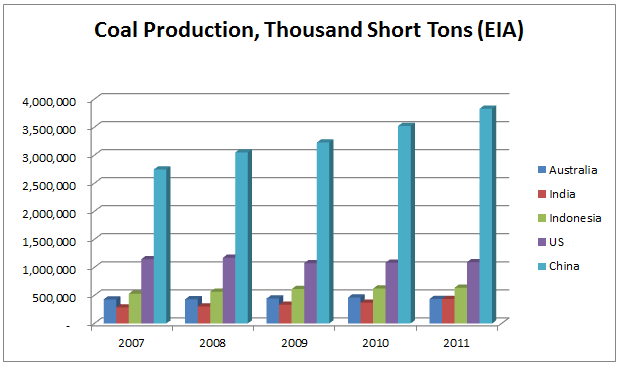 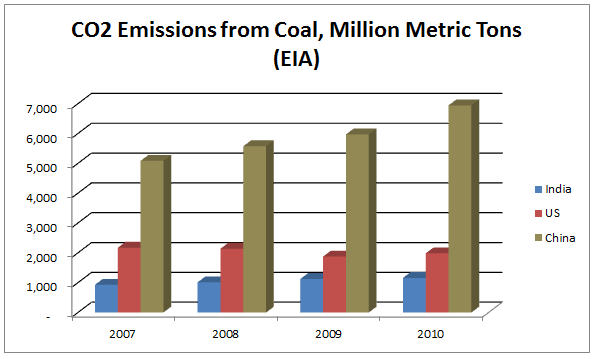 Why not use only emission-free sources? a) installed capacity is cheaper and most is coal, nuclear, and natural gas, b) a comparison of new plant costs by technology shows renewables are expensive, c) solar and wind plants can't operate 24/7. 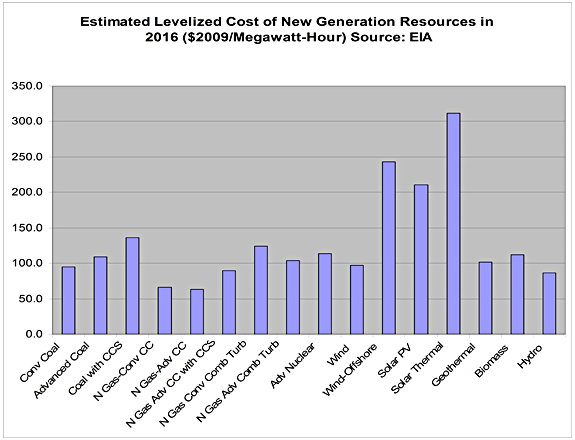 Previous Free Quarterly Updates
|

All content © Copyright 2025 | Starks Energy Economics, LLC.