 |
 |
 |
 |
 |
 |
 |
 |
 |
 |
      |

Starks Energy Economics, LLC 1st Quarter 2013Focus: Besides Better Weather, What Does It Take to Operate an Oil Refinery on the US East Coast?Setting aside its weather travails, the US East Coast/Petroleum Administration for Defense District 1 (USEC, or PADD 1) poses an interesting conundrum. It comprises seventeen states and the District of Columbia, with over a third of the country's population--120 million people--but contains only seven percent of the country's oil refining capacity. Hess just announced it will be closing its 70,000 barrel-per day (BPD) catalytic cracking facility at Port Reading, NJ. According to the Energy Information Administration (EIA), this is not expected to impact USEC gasoline markets. The area's gasoline consumption of about three million barrels per day (MMBPD) is thirty-five percent of US gasoline consumption. Its overall petroleum product consumption of 4.7 MMBPD is about a third of US consumption, also in line with its population proportion. (The first graph shows volumes in thousands of gallons per day.) Taking Hess' shutdown as symptomatic, why is PADD 1's proportion of the country's refining capacity only a fifth of its use of petroleum products? The first answer is that despite the discovery of oil in Pennsylvania in the mid-1850s, subsequent oil discoveries in California, Oklahoma, Texas, Louisiana, (late 1800s-1920s) and Alaska (1960s) dictated the location of refineries away from the USEC. The newest complex refinery in the US was built over thirty-five years ago in Garyville, Louisiana in 1976. Twelve small, simple refineries, including five of Alaska's six refineries, have been built in the US since. "Complex" and "simple" are here used as technical terms referring to the existence ("complex") or absence ("simple") of catalytic cracking and coking units. PADD 1 has 1.3 MMBPD of operable refining capacity out of the country's 17.4 MMBPD. The Gulf Coast (PADD 3) has just over half at 8.7 MMBPD, the MidContinent (PADD 2) has 3.7 MMBPD, the West Coast (PADD 5) has 3.0 MMBPD, the Rockies (PADD 4) have 0.6 MMBPD. Of the fifteen refineries on the East Coast, four are closed or closing. In particular, Sunoco closed two big refineries, dismantling one completely, after losing over $800 million on its refining business in the three prior years. Its third refinery was saved only with regulatory and political pixie dust—more below. Among the major refiners—Chevron, ExxonMobil, Shell, Valero, Phillips 66, Marathon Petroleum—only Phillips 66 and Chevron have USEC refineries, one apiece. Three more of the East Coast's fifteen refineries are small or specialty refineries making lubes and asphalt, not transportation fuels. Overall, the squeeze from high crude oil costs, high operating costs, and the large capital outlay necessary to meet New York State's new specifications for ultralow sulfur diesel and heating oil has meant a rush for the exits in the past few years as companies saw their USEC refining losses continuing unendingly into the future. The second answer can be asked as a question. Is it really an issue if the USEC has relatively little refining capacity compared to its consumption? Maybe not. As the second graph shows, the USEC imports 55 percent of its gasoline from other areas in the US and from outside the US. It is instructive to see that ten percent of USEC "gasoline" volume is ethanol. The USEC is also served via the massive Colonial product pipeline from the US Gulf Coast. Indeed, Gulf Coast refineries now have enough excess capacity relative to reduced US demand that after sixty years, they have resumed exporting products, mainly to Central and South America. The bottom line is exactly that: it's cheaper to refine oil elsewhere and ship the resulting gasoline, jet, and diesel to the USEC to meet its demand. While imports can bring balance-of-trade issues and pipelining can (rarely) be brought to a halt as it was due to pump electricity outages from Hurricane Katrina, the USEC has multiple petroleum product sources. The third answer is that the crude supply situation is changing. As the third and fourth graphs illustrate, both Canadian and US oil production have increased substantially in the last few years. With these large increases, plus condensate production from Pennsylvania's Marcellus play, and the ability to ship crude by rail and barge to USEC refineries, crude oil is more available to the USEC than it ever has been. Crude oil price differentials are also more dynamic than they have been historically. This represents the success of producing Western Canadian Select (WCS) from oil sands and in the US-- light sweet crude from the Bakken, condensate from the Marcellus, as well as the indirect force of additional production from West Texas, South Texas, Oklahoma, and Colorado. For example, at the close of the markets last week, North Seas Brent was $118.99/bbl, West Texas Intermediate (WTI) was $95.76/bbl, Bakken at Clearbrook, MN was $92.76/bbl, and WCS was $69.42/bbl. The Jones Act limits the shipment of crude oil produced on the Gulf Coast—like from the new Eagle Ford Shale—to the East Coast. (The Jones Act requires any shipment from one US port to another be carried on vessels built in the US, owned by US citizens, and operated by a US crew.) In practice, Jones Act shipping means the supply of available vessels is limited and costs three to four times that of a non-Jones-Act vessel. However, Eagle Ford oil arrives at the USEC indirectly: it is a feedstock for nearby Texas refineries that then ship gasoline, jet, and diesel to the USEC. Heavy Canadian crude—bitumen—can be shipped by rail, or it can be blended with light diluents to ship by pipeline. The co-production of NGLs and condensate with oil and natural gas has increased the supply of diluent for bitumen, although pipeline space is limited. PBF, which has two USEC refineries, has just announced it will double crude-by-rail receipt of Canadian oilsands crude from 40,000 BPD to 80,000 BPD by the end of the year. Additionally, a new rail facility at the Philadelphia Energy Solutions refinery is slated to be able to unload 140,000 BPD of Bakken crude. The drilling boom that led to increased oil supplies also led to the discovery of a massive USEC natural gas reserve—the Marcellus in Pennsylvania. Because of this new supply, manufacturers, including refiners, can both fuel their existing plants with cheaper natural gas and expand in the US instead of expanding overseas, something that hasn't happened since the 1980s. And the fourth answer—regulation, politics, and the politics of regulation—is also a factor. The Philadelphia Energy Solutions refinery is particularly instructive. One assist: Pennsylvania state governor Tom Corbett provided support of $55 million to the Philadelphia and Delta Trainer, PA refineries. A third Sunoco refinery--335,000 BPD in Philadelphia, representing a quarter of USEC capacity, was slated for shutdown because it, too, was losing Sunoco and its shareholders millions of dollars. Instead, with officials sensitive to high gasoline prices just prior to the 2012 elections, private equity firm Carlyle (yes, same kind of firm as Bain) took the lead in what became the Philadelphia Energy Solutions refinery. Carlyle combined its own support, support from the state of Pennsylvania, a partnership with JP Morgan, and Sunoco's ownership-turned-minority interest to keep the refinery open. Vigorous effort by the area's congressman, Rep. Bob Brady (D-Pa) led to a crucial multi-year waiver by the EPA of its new source review for the refinery's expansion. Undergoing the expensive, time-consuming, and publicly-demanding effort of new source review would have made it impossible to upgrade the Philadelphia refinery or operate it profitably. Voilà, the refinery stayed open. 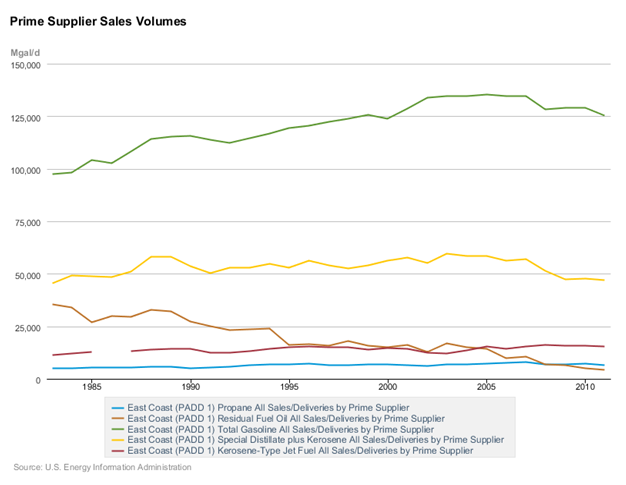 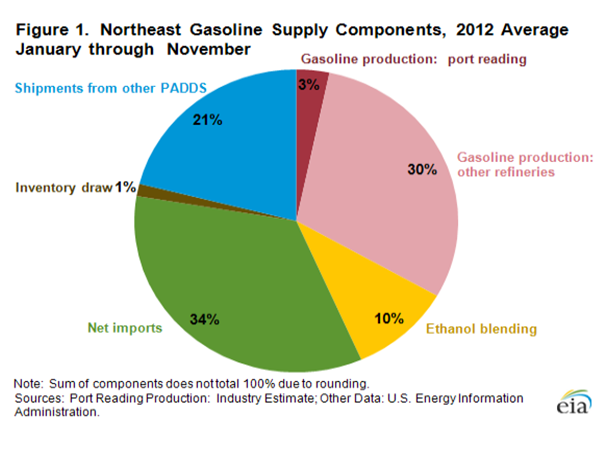 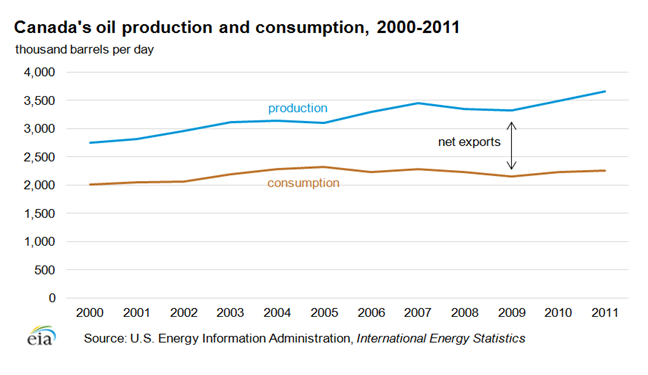 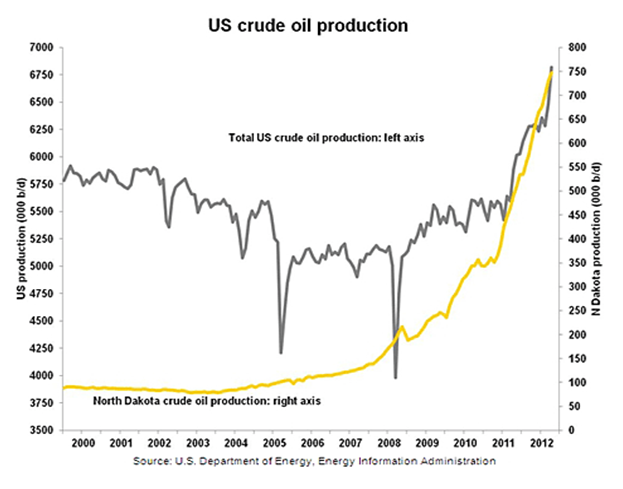 Previous Free Quarterly Updates
|

All content © Copyright 2025 | Starks Energy Economics, LLC.