|
|


| |

3rd Quarter 2013 SEE Update
By Laura Starks, CEO, Starks Energy Economics, LLC
Signal vs. Noise: Energy Sources Fueling the United States Now
In considering energy sources and uses, we should start with our current position. It can be summarized in just three graphs.
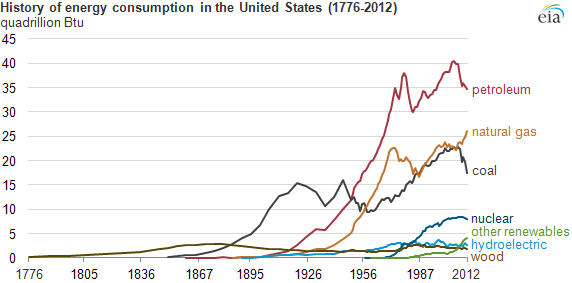
This chart from the US Energy Information Administration (EIA) shows several remarkable trends:
- Wood was 100% of our fuel until about 1850;
- Coal then predominated as the country industrialized;
- Oil came to the fore, allowing an increase in transportation and trade;
- In the last eighteen months, cheap natural gas displaced a sizable amount of coal, about five quadrillion BTUs;
- Other renewables (besides wood and hydroelectric) are growing, but they are still only about four percent of the mix.
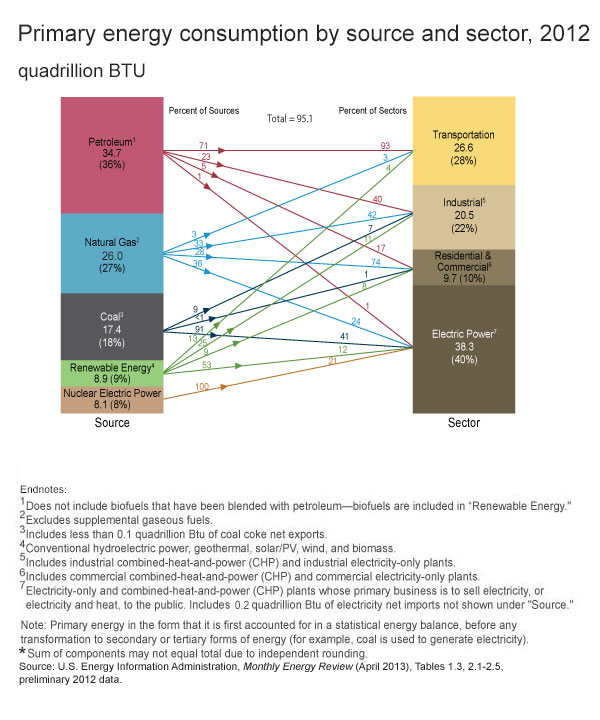
This convenient EIA graph shows fuel use by sector. The most competitive sector is electric power. By contrast, the US is undiversified and vulnerable in the transportation sector because we rely almost wholly (93%) on oil.
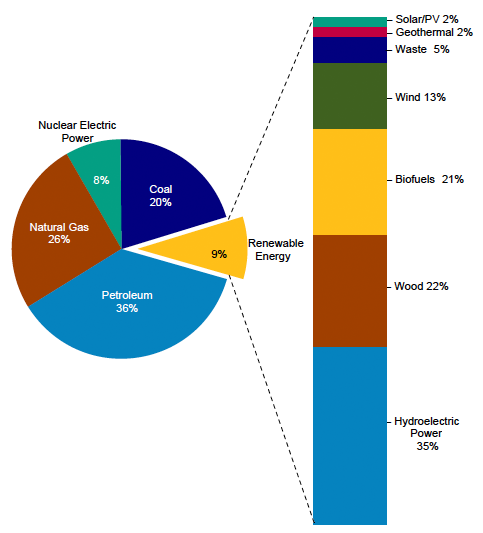
Finally, this EIA illustration, like the previous two, shows that hydrocarbons are the critical mass of our basic energy supply—over eighty percent.
Note the pullout bar showing the biggest portion of renewables to be hydroelectric power, wood, and biofuels. Biofuels consist mainly of corn-derived ethanol.
Use of wind (13% of 9%), solar (2% of 9%), and biofuels (21% of 9%) have grown due to regulatory mandates rather than market-competitive costs.
Next quarter we will consider forecasts of the future US energy mix. The recently-developed technologies allowing economic production of billions more barrels of oil and trillions more cubic feet of gas have upended supply dynamics.


sitemap | home | contact us | bio | links | events
|
|
|