|
|


| |

October 2015 SEE Monthly Update -
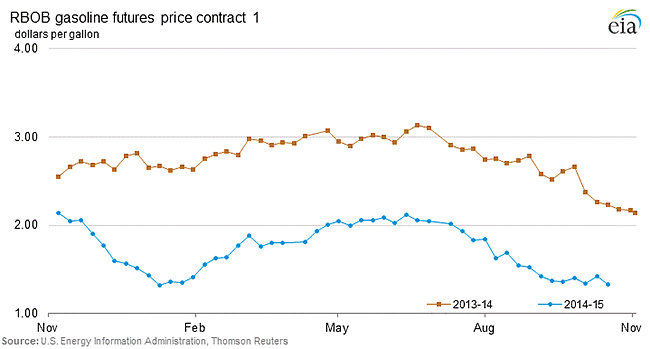
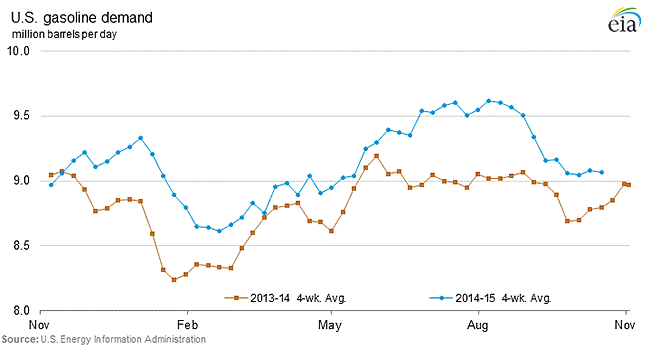
Life at the Pumps: Gasoline Demand—Analysis in Two Graphs
This month's note will be brief.
As the graphs above show, year-over-year gasoline prices are lower and demand is higher. This is occurring quickly, which is notable because in the short term, gasoline demand is fairly inelastic. "Inelastic" means consumers don't/can't immediately change our buying behavior with a price change. In the short run, we don't buy larger or more vehicles or use more gasoline in direct (1:1) proportion to the price drop. Over time, demand is more elastic—it does change more. Thus, the one-year demand increase in reaction to the gasoline price reduction is even stronger than it appears.
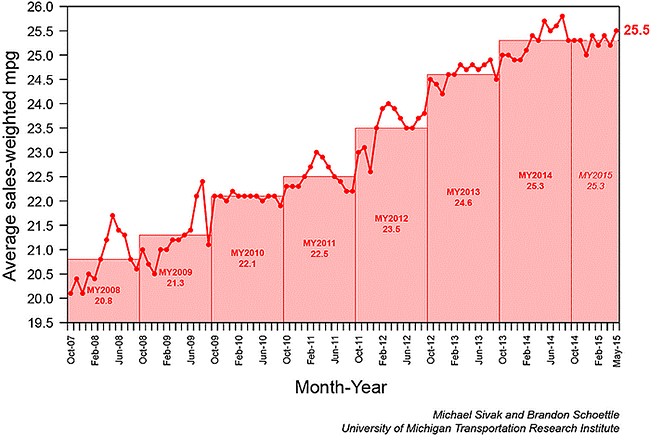
This is also compelling given the background of increasing corporate average fuel economy (CAFE) standards required for new cars. The graph below shows the increase in average fuel economy for light vehicle sales.
For more on this topic log in now or, if you are not already a subscriber, subscribe now.
Copyright 2015, Starks Energy Economics, LLC. This information is confidential and is intended only for the individual named. This information may not be disclosed, copied or disseminated, in whole or in part, without the prior written permission of Starks Energy Economics, LLC. This communication is based on information which Starks Energy Economics, LLC believes is reliable. However, Starks Energy Economics, LLC does not represent or warrant its accuracy. This communication should not be considered as an offer or solicitation to buy or sell any securities.
I, Laura Starks, do hereby certify that, to the best of my knowledge, the views and opinions in this research report accurately reflect my personal views about the companies and their securities as of the date of this report. These viewpoints and opinions may be subject to change without notice and Starks Energy Economics, LLC will not be responsible for any consequences associated with reliance on any statement or opinion contained in this communication.

- Whale Watch: Dividend Hunting at Integrated Internationals, Late September/Early October 2015
- Enduring the Downturn; Bakken Resilience - August 2015
- California Refiners - July 2015
- Bakken Producers, US vs. OPEC vs. Russia, Epstein book - June 2015
- Investor Momentum, Oklahoma Earthquakes, Bakken Rail Transport - May 2015
- Regulatory Changes, Earthquakes, and Proppant Companies - April 2015
- Oil Field Services Stress Tested - February 2015
- Haynesville, Louisiana Dry Natural Gas Field - January 2015
- Is the Permian a Bargain Basin Yet? - December 2014
- Starks Energy Economics on Natural Gas - 4th quarter 2014
- Eagle Ford Energy - 3rd quarter 2014
- The Power of the Permian - 2nd quarter 2014
- Ethylene, Star Petrochemical with Renewed Luster - 1st quarter 2014
- Pipeline Drag Reducers - 4th quarter 2013/1st quarter 2014
- Signal vs. Noise: Energy Sources Fueling the United States Now - 3rd quarter 2013
- Natural Gas: Heating, Electricity, Industrial Use, Transport Fuel, Export, or All of the Above? - 2nd quarter 2013
- Besides Better Weather, What Does It Take to Operate an Oil Refinery on the US East Coast? - 1st quarter 2013
- Oil Industry in North Dakota Continues Booming - 4th quarter 2012
- Low First-Half Natural Gas Prices Help Clean the Air - 3rd quarter 2012
- Permian Basin, West Texas and New Mexico - 2nd quarter 2012
- US MidContinent Refineries - 1st quarter 2012
- North Dakota's Bakken Oil Shale Production - 4th quarter 2011

sitemap | home | contact us | bio | links | events
|
|
|