 |
 |
 |
 |
 |
 |
 |
 |
 |
 |
      |

January 2016 SEE Monthly UpdateOil Export/Energy Bill Winners and Losers **Attention: In contrast to a more typically relaxed pace for SEE, we recommend subscribers look at the subscriber-only section before the Tuesday, January 19th market open. The year began jaggedly for oil producers and profitably for oil consumers. Prices have fallen to less than $30/barrel for the lightest crude and as little as $15/bbl for remote, heavy, or sour crude. The Dow Jones Industrial Average is down to 15988 in a 2000-point (11%) drop from its most recent high in early December, unusual for January trading. Two big uncertainties plague oil prices: the impact of formerly-sanctioned Iranian oil coming onto the world market (estimates range from 300,000 barrels per day (BPD) to 1 million BPD) and the true size of the decline in Chinese internal demand for oil. While China is importing about ten percent more crude oil than a year ago, its product (gasoline, diesel, fuel oil) export level is the highest ever, over a million barrels a day. Other uncertainties remain about continued high Saudi production and the rate at which US production will fall. US oil production was 9.4 million BPD in 2015 and the Energy Information Administration projects it to be 8.7 million BPD in 2016. This is a slower-than-expected drop despite the fact that much new production has been from high-cost horizontal wells with very rapid (+60%/year or more) declines. 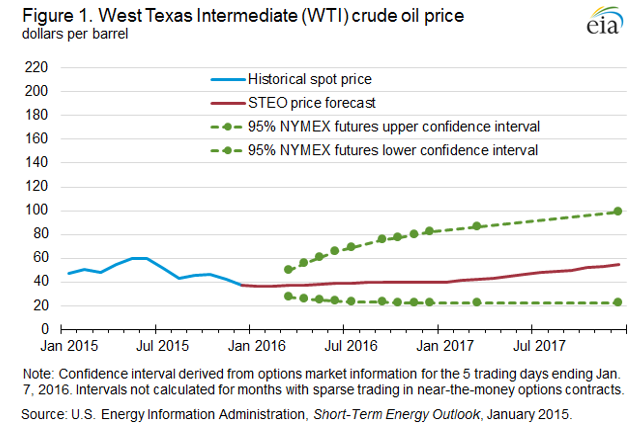 While one may question Continental Resources boss Harold Hamm's prediction of $60/bbl oil prices by year-end 2016, he is right that the Saudi overproduction has had a boomerang effect: US companies and oil states have dreamt of erasing the forty-year-old US oil exports ban and now it has happened. The first US crude oil export tanker under the new law sailed a few weeks ago. More are lined up at Corpus Christi and other ports. As part of the same approved Congressional bill, tax credits for renewable solar and wind energy were also extended. So who wins and who loses from these changes in energy policy events? Winners include: Crude-carrying tankers, when the differential between US prices and other world prices merits the transportation cost; World refiners without complex upgrading capability who preferentially use light crude; Oil pipelines to the Gulf Coast (although they are also on the losing end from lower US production levels); Wind and solar energy producers who benefit from the renewable energy tax credits; US oil producers who can now sell to the larger world market; this also helps Bakken (and Canadian) producers because it diffuses competitive pressure from the Permian and other US light oil basins; Corpus Christi's port business; and Global oil products consumers. Losers include: US-flagged tankers (Jones Act tankers)—previously the only way light crude could be shipped on the water, and then only to other US refiners was on one of these 43 vessels; US refiners, although they are also winners to the extent that building more light-crude handling facilities may be unnecessary. They have also been huge winners overall with the dramatically lower oil prices; Other light oil producers, such as Libya, Nigeria, Algeria, and Angola. Although oil is a global market and these countries have already felt the sting of US competition, US oil will now be reliably available to buyers. In the subscription section, we review financials of three companies affected by US crude exports and renewable tax credit extensions. We also highlight some news about energy loans. For more on this topic log in now or, if you are not already a subscriber, subscribe now. Copyright 2016, Starks Energy Economics, LLC. This information is confidential and is intended only for the individual named. This information may not be disclosed, copied or disseminated, in whole or in part, without the prior written permission of Starks Energy Economics, LLC. This communication is based on information which Starks Energy Economics, LLC believes is reliable. However, Starks Energy Economics, LLC does not represent or warrant its accuracy. This communication should not be considered as an offer or solicitation to buy or sell any securities. Previous Free Monthly Briefs (12/2014 to current)/Quarterly Updates (2011 to 2014)
|

All content © Copyright 2025 | Starks Energy Economics, LLC.