 |
 |
 |
 |
 |
 |
 |
 |
 |
 |
      |

March 2017 SEE Monthly UpdateComplex PADD III Gulf Coast Refineries Benefit
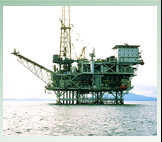
Companies with complex (cracking and coking) refineries on the US Gulf Coast operate in one of the most sophisticated and competitive markets in the world. PADD III (Petroleum Administration for Defense District III), which includes the Gulf Coast, has about 9.5 million barrels per day of refining capacity, or about half the US total. From their location on the Gulf of Mexico, refiners can source crude from almost anywhere. However, US producers themselves are no longer captive; they too can export their crude as well as sell it in the US. Fortunately, refiners are also able to export products, and their exports are increasing. Due to the expense and size of refiners’ capital improvements, companies plan decades into the future. Before the US shale revolution, refiners expected to import large volumes of heavy, sour crude and so configured their refineries for those crudes with billions of dollars of equipment upgrades. When more light, sweet crude was produced in the US through fracking and horizontal drilling, refiners refitted to handle more light ends. However, they maintained and continue to use the capacity they had developed to handle worse (cheaper) crudes from elsewhere. At the opening this week of a large Houston industry conference, ExxonMobil pledged $20 billion in investment in eleven US Gulf Coast projects, reinforcing its regional attrativeness for the refining and petrochemical sector. The change in the Obama-to-Trump regulatory regime appears to generally benefit US refiners. This ranges from higher production of US crude oil, the prime refining feedstock and major cost, to delay of steep 2025 fuel economy benchmarks (vehicle average of 54.5 miles per gallon or 40 miles per gallon in “real-world driving”). More information about expected demand growth and specific sand and proppant companies can be found in the subscriber section. For more information, log in now or, if you are not already a subscriber, subscribe now.
Copyright 2017, Starks Energy Economics, LLC. This information may not be disclosed, copied or disseminated, in whole or in part, without the prior written permission of Starks Energy Economics, LLC. This communication is based on information which Starks Energy Economics, LLC believes is reliable. However, Starks Energy Economics, LLC does not represent or warrant its accuracy. This communication should not be considered as an offer or solicitation to buy or sell any securities.
|


All content © Copyright 2025 | Starks Energy Economics, LLC.