 |
 |
 |
 |
 |
 |
 |
 |
 |
 |
      |

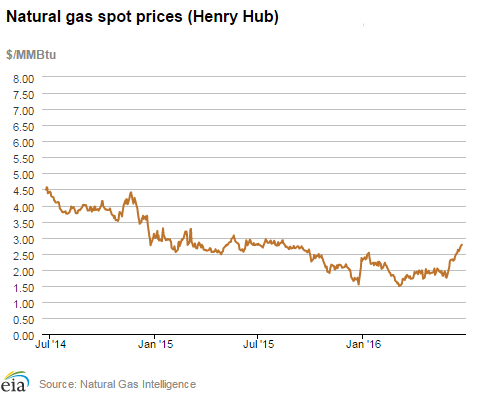
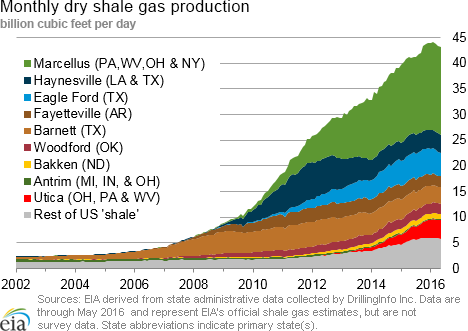
Late June/July 2016 SEE Monthly UpdateMany Still Producing Natural Gas in PA-OH Marcellus Near-term market focus for both financial and commodity markets will be changes resulting from the U.K's decision via referendum to exit the European Union ("Brexit") of 28 countries. From a business and political perspective, this will require renegotiation of thousands of contracts and agreements. In the short term the dollar is stronger, which tends to drive the prices of oil and natural gas lower. Looking closer to home, the Marcellus region (Pennsylvania, West Virginia) has endured a substantial reduction in the number of companies operating there as natural gas prices fell drastically a few years ago. For example, by February 2016 only 19 rigs were operating in Pennsylvania, down from 114 in 2012. Marcellus production nonetheless remains a high 17.5 billion cubic feet (Bcf)/day, about a fourth of total US injection-season production of 73 Bcf/day.  So as gas use for summer electric cooling accelerates more than expected, winter storage injection season starts, markets begin rebalancing supply, and US exports of liquefied natural gas increase, consider this largest US gas play. According to one company website, "The Marcellus Shale, a "super giant" gas field, has enough resources to meet the energy needs of every American home, business and industry for an estimated 20 years, all on its own." In its latest Short-Term Energy Outlook, the Energy Information Administration (EIA) cautions, "Natural gas working inventories were 2,907 billion cubic feet (Bcf) on May 27. This level is 32% higher than a year earlier, and 35% higher than the previous five-year (2011-2015) average for that week. The natural gas storage injection season typically runs from April through October. EIA projects that natural gas inventories will be 4,161 Bcf at the end of October 2016, which will be the highest end-of-October level on record (SEE emphasis added). Henry Hub spot prices are forecast to average $2.22 /million British thermal units (MMBtu) in 2016 and $2.96/MMBtu in 2017, compared with an average of $2.63/MMBtu in 2015."  For more on this topic log in now or, if you are not already a subscriber, subscribe now. Copyright 2016, Starks Energy Economics, LLC. This information may not be disclosed, copied or disseminated, in whole or in part, without the prior written permission of Starks Energy Economics, LLC. This communication is based on information which Starks Energy Economics, LLC believes is reliable. However, Starks Energy Economics, LLC does not represent or warrant its accuracy. This communication should not be considered as an offer or solicitation to buy or sell any securities. Previous Free Monthly Briefs (12/2014 to current)/Quarterly Updates (2011 to 2014)
|

All content © Copyright 2025 | Starks Energy Economics, LLC.
